AI Illustration and Interactive Data Design for the Reader
How to design AI-generated illustrations and interactive data visuals that enrich the reading experience for Arabic-language audiences — tools, prompts, and workflow.
Workshop: Multimodal Blogging · Article 3 of 5
In Article 1 of this series we laid out the strategic framework for format selection: images and data visualization serve rapid comprehension of complex relationships, and they are the most shareable format across social platforms — the format most likely to extend reach beyond your existing audience. In Article 2 we mastered the audio layer.
This article addresses the visual layer — the one most likely to determine whether a reader shares your content or scrolls past it. It comes with specific challenges when your audience is Arabic-speaking: right-to-left text direction, aesthetic conventions that differ from Western design templates, and a near-total absence of Arab faces and environments in default stock image libraries.
These challenges are solvable. That is precisely what this article covers.
Three Types of Visual Content Your Platform Needs
Before discussing tools, it helps to distinguish between three types of visual content that serve different purposes:
The featured image: The first thing a reader sees before deciding whether to click. Its job is to stop the scroll and generate curiosity — not to explain. It works through emotion and aesthetics more than information. It has the greatest impact on click-through rate of any visual element on the page.
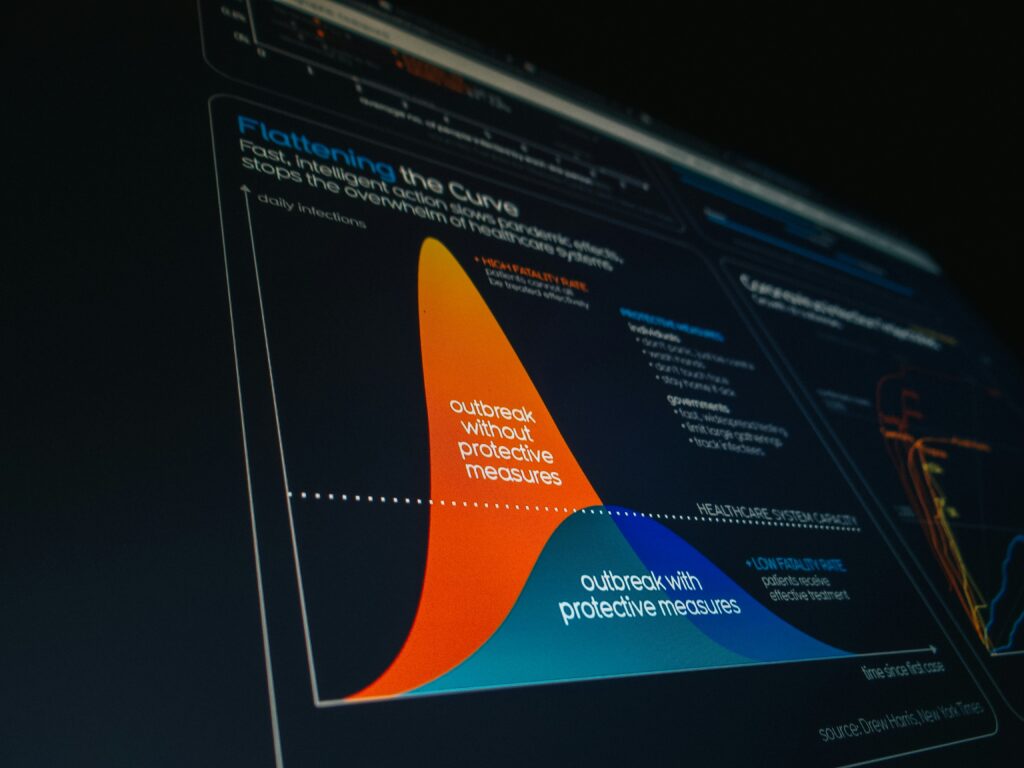
The in-article infographic: Explains a complex relationship, compares options, or summarizes a multi-step process. It is read instead of text, not in addition to it — when a good infographic is present, the paragraph that follows it can be reduced to a single sentence.
The embedded interactive element: A sortable table, a chart that responds to hover, a simple calculator. It converts the reader from a passive consumer into an active participant and measurably increases time on page.
Not every article needs all three. The featured image is always mandatory. The infographic is added when the article contains a comparison, a process, or data that is difficult to absorb as prose. The interactive element is worth the effort when the topic has a personal dimension that varies from reader to reader.
Generating Featured Images: Tools and Prompts
Midjourney remains the highest-quality tool for artistic and illustrative images, but its Discord-based interface impedes regular production workflows. Adobe Firefly is the best option for anyone with an Adobe subscription because its outputs are commercially guaranteed to be free of copyright issues. DALL-E 3 embedded in ChatGPT is the fastest for daily use and the most responsive to detailed instructions in either English or Arabic.
A problem every Arab content creator encounters: most of these tools, when asked for “a person,” “an urban environment,” or “an everyday scene,” automatically return images with Western faces and American or European settings. The solution is in the prompt, not the tool:
[For featured images with cultural specificity]

Create a [illustration style: flat design / editorial illustration /
abstract conceptual] image for an Arabic-language article about [topic].

Visual direction:
- Middle Eastern or North African visual context (architecture, lighting,
  color palette warm earth tones)
- If people are included: diverse Arab appearance, modest contemporary dress
- Text direction awareness: leave right side of composition heavier/anchor
  (Arabic readers scan right-to-left; visual weight should follow)
- No Latin text or Western signage visible
- Color palette: [specify to match your brand — e.g., deep blue and crimson /
  warm terracotta and gold / clean white and teal]

Mood: [professional and trustworthy / contemplative and literary /
energetic and forward-looking]
Style reference: [editorial magazine illustration / flat vector /
photorealistic / painterly]

Do NOT include: stock-photo aesthetics, generic office environments,
obviously Western faces or settings.
Infographics: Three Templates That Cover 80% of Your Needs
Most of the infographic content a professional blog needs falls into three templates. Having a ready-made template for each in Canva means infographic production takes 15–20 minutes rather than an hour or more.
The comparison template — two or three columns comparing options, tools, or approaches. Works for any content that answers the question “which is better?” Structure: title at the top, comparison criteria on the right (following Arabic reading direction), options arranged horizontally across columns.
The process template — sequential steps from start to finish. Works for any content that answers the question “how?” In Arabic design: the process flows right to left — a mistake many designers make when using English templates without adjustment.
The visual statistics template — one large number or three key figures with visual context — icons or shapes representing proportions. Works for any content containing surprising or noteworthy data worth highlighting.
To create these three templates from scratch, use this prompt with DALL-E or Midjourney to get the basic visual structure:
Create a clean infographic template layout for a [comparison / process /
statistics] infographic.

Requirements:
- Right-to-left layout orientation (Arabic reading direction)
- No text included — placeholder boxes and shapes only
- Color scheme: [your brand colors]
- Style: flat design, professional, minimal
- Dimensions: [1200x800px for article embed / 1080x1080px for social square /
  1080x1920px for vertical social]
- Include clear visual hierarchy: large header area, main content zones,
  footer area for source attribution

Export as transparent PNG or editable format.
Interactive Elements: Simpler Than You Think
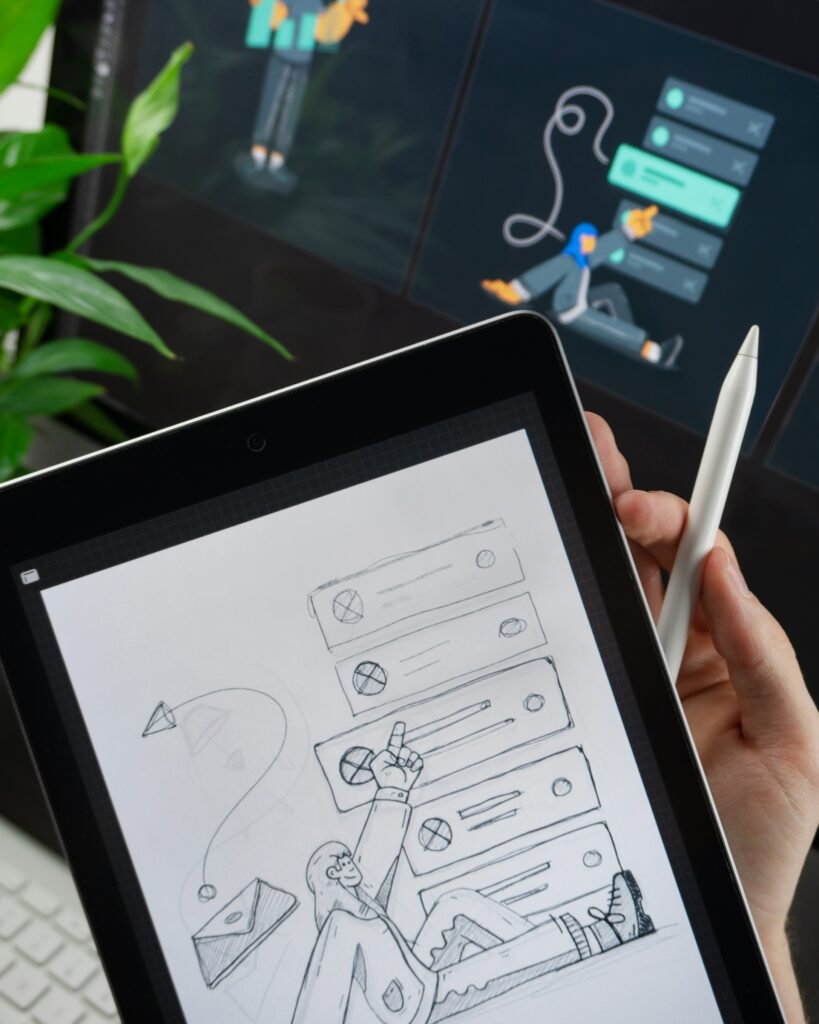
Interactive elements intimidate many bloggers because they assume they require coding knowledge. In practice, the simplest interactive elements — and the most effective — require writing no code at all.
Sortable tables: Any comparison table in your article can become interactive by adding the TablePress plugin (free) on WordPress. It lets readers sort the table by any column that interests them — a feature that measurably increases engagement time in any content comparing tools, options, or prices.
Interactive charts: Datawrapper is free for basic use and allows you to create interactive charts (line, bar, bubble) that can be embedded in WordPress with a single code snippet. It supports Arabic and allows color and font customization. Taking data from a regular table and converting it into an interactive chart takes no more than 10 minutes.
Simple calculators: For topics that lend themselves to personal calculation — project cost, task completion time, pricing comparison — the Calculated Fields Form plugin on WordPress allows you to build a simple calculator with a drag-and-drop interface and no coding. This type of element gets shared frequently because it gives each reader a result that is uniquely theirs.
The rule: start with the simplest interactive element that answers a question your reader is already asking themselves while reading. Interactivity added for its own sake has no value — interactivity that answers a real question turns a reader into a repeat visitor.
Interactive Element Examples
Three live demos — sortable table, interactive chart, calculator
| Tool ⇅ | Type ⇅ | Rating ⇅ | Price $/mo ⇅ | Arabic Support ⇅ |
|---|---|---|---|---|
| ElevenLabs | Voice generation | 4.8 | 5 | Good |
| Murf | Voice generation | 4.5 | 29 | Excellent |
| Opus Clip | Short video | 4.2 | 0 | Good |
Visual Identity Across Articles: Consistency Before Beauty
The most common mistake in visual content for solo bloggers is excessive variety — every article in a different visual style, every featured image with a new color palette. The result is a platform that looks like it was produced by multiple people rather than a single editorial voice.
A blog's visual identity does not require a professional designer. It requires three fixed decisions applied to every piece of content:
- A fixed color palette: Two primary colors and one accent. Every featured image and every infographic uses only these three colors. Taking the hex codes from your existing site identity and committing to them is entirely sufficient.
- A fixed illustration style: Are your featured images processed photography, flat illustration, or geometric abstraction? Choose one style and maintain it across all articles.
- A fixed heading size for text within designs: When you add text to a generated image, use the same font and size every time. This small consistency is what makes a returning visitor immediately recognize they are on your platform.

What's Next
Article 4 addresses SEO and discoverability for visual and audio content — specifically, how to optimize images, audio files, and video embeds so your content ranks in visual search and AI-generated answer surfaces, not just traditional text search. (See our article: Multimedia SEO: Making Your Content Visible in the Age of Visual Search)
And for those who want to revisit the strategic framework that determines when visual content should be added and when it should not: (See our article: Content Strategy in 2026: Why Text Alone Is No Longer Enough)
References
- Cairo, A. (2016). The Truthful Art: Data, Charts, and Maps for Communication. New Riders.
- Knaflic, C. N. (2015). Storytelling with Data: A Data Visualization Guide for Business Professionals. Wiley.
- Nielsen, J. & Pernice, K. (2010). Eyetracking Web Usability. New Riders.
- Midjourney Documentation (2024). Prompting for Cultural Specificity. docs.midjourney.com